
After serving on the UK Inter-Agency Committee and its predecessor NERC Steering Committee since 1988, Professor Chris Collier provides a retrospective look on radar hydrology. “Radar has been used as an important tool for meteorological research, and, more recently, in operational forecasting over the last sixty years or so. However, its use in hydrology has only flowered over about half this period. In the UK the instigation of radar hydrology can arguably be traced back to the Dee Weather Radar Project (DWRP), which began in 1966, and then was referred to in 1974 as the Dee Weather Radar and Hydrology Project.
Christopher G. Collier received a BSc in Physics and an ARCS in Science at Imperial College, London in 1968. Subsequently he received a PhD (1999) and a DSc (2008) from the University of Salford. He joined the Meteorological Office in 1968, and later chaired the European Union International Weather Radar Networking project. He left the Met Office in 1995, becoming a Professor of Environmental Remote Sensing at the University of Salford, and joined the National Centre for Atmospheric Science based at the University of Leeds, becoming Professor of Atmospheric Science and Head of Strategic Partnerships in 2009. He was awarded the first WMO Vilho Väisälä Award for radar measurements of precipitation in 1986. In 2015 he was appointed an Emeritus Professor at the University of Leeds.
The quantitative use of radar data has been underpinned by close collaboration between hydrological agencies, the Met Office and, initially, the support of Plessey Radar Ltd. This was recognised by the formation of the Inter-Agency Committee on the Hydrological Use of Weather Radar involving these organisations and others active in radar applications including academia. This personal retrospective attempts to highlight some significant milestones which have led to the current status of radar hydrology in the UK.
Unfortunately the progress has not always been smooth. Many hydrologists have been wary of the uncertainties in radar measurements of precipitation. Indeed, even now there remains a cautious approach to using radar data quantitatively in hydrological forecasting. It is only very recently that new radar technology and data processing techniques are beginning to provide the operational confidence sought over many years.
We begin with the Dee Weather Radar Project implemented following an agreement between the former Water Resources Board (WRB) and Plessey Radar Ltd. The agreement provided for the WRB to finance the capital cost of the Project, Plessey Radar Ltd to supply the radar on free loan, the Met Office to operate the radar and the WRB and the Met Office to allocate considerable staff time to the Project. An S-band radar (10cm wavelength, 2 degrees beamwidth) was installed in 1970 on the Llandegla moors near Wrexham in North Wales together with a network of Plessey MM3 0.2mm tipping bucket raingauges, eventually numbering 76 throughout the Dee river valley. The radar data were collected for off-line analysis from 1971 to 1973 using a specially developed automatic echo signal analyser and magnetic tape recorder. The digital recordings of raw radar echo data and raingauge data from the WRB at Reading (the Water Data Unit) were passed to the Met Office at Bracknell for further processing. From 1975 to 1976 the radar data were processed in real-time using an on-site PDP-11/40 mini-computer, software for which was developed at the Met Office Research Unit (later the Met Office Radar Research Laboratory, MORRL) with a Royal Radar Establishment (RRE, later the Royal Signals and Radar Establishment, RSRE). This was a major step forward and laid out a pathway for the development at the MORRL of real-time digital radar network processing.
In late 1973 the radar was converted from S-band to C-band (5.6cm wavelength 1 degree beamwidth). Although the wavelength was known to be more susceptible to attenuation by rain, it reduced the amount of permanent echo (where part of the beam intersects the ground). The beamwidth reduced the effect of low level changes in precipitation and reduced the number of occasions when sleet was intersected at the melting level (known as the bright-band). Also pulse volumes at elevations of 0.5 and 1.5 degrees were essentially independent, this being an aid to correcting for bright-band errors.
The off-line analysis of the accuracy of hourly sub-catchment (about 100km2) rainfall totals using radar data with raingauge adjustment carried out at the end of each hour, gave a difference from the optimum estimates (raingauge network with interpolation using the radar pattern) of 15% within 15km of an adjustment gauge, and 20% at a distance of 20km within 75km of the radar site. This level of performance remains largely unchanged to this day, although as we shall see multi-parameter radar offers new approaches to accuracy improvement. Only limited snow depth data were collected, but the indication was that radar measurements of areal snow depth were comparable with the accuracy of areal measurements of rainfall.
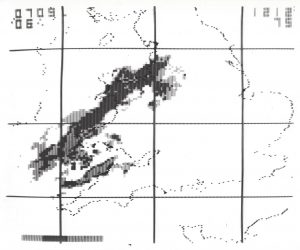
In 1971 the Directing Group of the DWRP established a small committee comprising members of Plessey Radar Ltd, the Met Office and the WRB to discuss the operational requirements and operational systems necessary to provide a rainfall service using radar. The group known as the Operations Systems Group specified the potential benefits of a network of weather radars, possible locations and potential users. However, such plans could only come to fruition with the development of an unmanned radar system. The technical details of such a network were formulated by the joint MORRL – RRE team at Malvern (Browning and Bulman, 1971). An early image at 07:09 on 12 December 1975 is shown in Figure 1 comprising radar data from the Llandegla radar and the Defford S-band radar located near Malvern.
The occurrence of the Skipton storm of 13 June 1979, which caused one death and major flood damage to about 100 domestic, industrial and commercial properties, further stimulated the need for close cooperation between meteorologists, hydrologists and the emergency services on a real-time basis. The first unmanned radar system was developed in the North West Radar Project, and was established in 1980 at Hameldon Hill near Burnley, North West England. This installation was funded by a consortium comprising the Met Office, the North West Water Authority, the Water Research Centre, the Central Water Planning Unit and the Ministry of Agriculture, Fisheries and Food. The system, possibly the first unmanned operational weather radar in the world, was underpinned by the work of the DWRP and the real-time processing techniques developed at Malvern.
The use of Doppler radar to measure radial wind as well as reflectivity had a rather uncertain start in part due to the difficulty of providing the necessary hardware and software changes to the existing radars. The requirements were specified in 1987, and a cost-sharing contract between the Met Office and Plessey Radar (by this time known as Siemens Plessey Radar) was agreed in early 1989 (Lilley, 1993). Plessey subcontracted to Lassen in the USA to develop most of the software for a workstation which was commissioned at the Cobbacombe Cross radar at the beginning of 1993. After some thought it was decided to assimilate the single component winds into the Met Office mesoscale numerical model (now the Unified Model). Work continues to assess the utility of such data.
Throughout the 1970s development and implementation of dual-polarisation radar was being carried out at the Chilbolton Observatory on the 25 m diameter antenna S-band radar. The benefits of this technology for operational radars was considered during the late 1980s and early 1990s, but it was not until 1998 that the requirements were specified by a Met Office experts committee comprising scientists from academia and the Met Office. The final report of this group set out the polarisation requirements, other criteria and a possible configuration for an operational polarisation diversity radar which the Met Office subsequently decided to manufacture themselves after considering commercial options.
Whilst the weather radar work was moving ahead, the necessary rainfall-runoff modelling for flood forecasting was also under development. The DWRP became the Dee Weather Radar and Hydrology Project (DWRHP). It was decided that, although some rainfall-runoff models in the early 1970s such as DISPRIN (Jamieson and Wilkinson, 1972) were hydrologically realistic, the simpler Inflow-Storage-Outflow (ISO) model (Lambert, 1972; McKerchar, 1975) was to be preferred for real-time work. The ISO model had the advantage that it was of simple form and feasible to run with the computer resources available at that time. Of course computers have since become much more powerful enabling more physically realistic models to be operated in real-time.
Rainfall input to a hydrological model was generally derived from raingauges, and even now this is often the case. However from October 1976 the DWHRP made radar estimates of rainfall available. Sub-catchment rainfall totals were derived from radar adjusted using raingauge data. It was to be some years before an operational high-resolution numerical weather model was to become available using assimilated radar data. One of the main outcomes of the work in the DWRHP using the rainfall-runoff model was the finding that errors in river flows even at 12 hours lead-time for the River Dee could be substantial underling the importance of quantitative precipitation forecasts. It was found that the peak discharge was relatively insensitive to timing errors in rainfall, but was governed mainly by rainfall volume. Also the rising limb of the hydrograph is more sensitive to rain in the immediate future, and the falling limb to the manner of cessation of the rain.
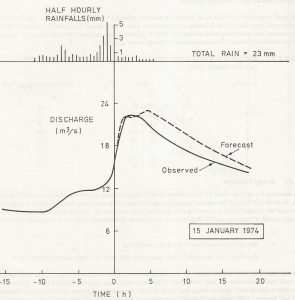
Underpinning the Lambert ISO model was a time delay between the rainfall input and catchment outflow along with a unique relationship between catchment water storage, S, and outflow, q, of the form S = k logeq; here, k is a storage parameter whose value is governed by the slope of the hydrograph recession. Figure 2 shows an example of the forecast and observed hydrographs for the Ceiriog sub-catchment for the 15 January 1974. The forecast is made two hours before the peak flow using a ‘perfect’ rainfall forecast based on rainfall observations.
Work continued after the DWHRP on distributed hydrological modelling using space–time estimates of rainfall from weather radar. However, because radar estimates of rainfall lacked consistent and quantitative accuracy, and the formulation of hydrological models in distributed form remained for some time complex, improved forecast accuracy was difficult to achieve. The simplest gridded hydrological models used only digital terrain data to delineate flow pathways and to control runoff production, and it was not until the early 2000s that distributed models using gridded radar-based rainfall estimators showed benefits for forecasting at ungauged locations.
Following severe flooding across the UK in 2007 a review led by Sir Michael Pitt was commissioned by the Government to see what lessons could be learned. The review produced a number of recommendations which were published in June 2008: among them was the recommendation that the different agencies, particularly the Met Office and the Environment Agency, work more closely together to improve warnings services. This led to the establishment of the Flood Forecasting Centre based at the Met Office, Exeter and the Scottish Flood Forecasting Service, Perth within which radar data and the Centre for Ecology & Hydrology’s Grid-to-Grid (Moore et al., 2006) model play an important part.”
Further Reading
Browning, K.A. and Bulman, P.J. (1971) National Weather Radar Network. Royal Radar Establishment, July, 17pp.
Dee Weather Radar Project (1973) The use of a radar network for the measurement and quantitative forecasting of precipitation. Report by the Operations Systems Group, Water Resources Board, Reading, 21pp plus appendices.
Dee Weather Radar and Real Time Hydrological Forecasting Project (1977) Report by the Steering Committee, Central Water Planning Unit, Reading, 172pp.
Lambert, A.O. (1972) Catchment models based on ISO-functions. J. Instn. Water Eng., 26, 413-422.
Lilley, R.B.E. (1993) The Met. Office Doppler Radar Project: Progress and Plans. Forecasting Research Division, Technical Report No. 71, Met Office, Bracknell, November, 5pp.
McKerchar, A.I. (1975) Subcatchment modelling for Dee River Forecasting. Institute of Hydrology Report No. 29, Institute of Hydrology, Wallingford, 61pp.
Moore, R. J., Cole, S. J., Bell, V. A. and Jones, D.A. (2006) Issues in flood forecasting: ungauged basins, extreme floods and uncertainty. In: I. Tchiguirinskaia, K. N. N. Thein & P. Hubert (eds.), Frontiers in Flood Research, 8th Kovacs Colloquium, UNESCO, Paris, June/July 2006, IAHS Publication 305, 103-122.
North West Weather Radar Project (1985) Consortium Report, NWW, Met Office, WRC, DOE, MAFF, 73pp.
Jamieson, D.G. and Wilkinson, J.C. (1972) River Dee research program 3. A short-term control strategy for multi-purpose reservoir systems. Water Resour. Res., 8(4), 911-920.